

What America’s independent businesses actually earn
Independent work is usually measured by headcount, rather than income. In an effort to better understand what these businesses actually earn, 1-800Accountant analyzed revenue and expense data from thousands of 1099 businesses, freelancers, and independent contractors across the country for The 1099 Earnings Report, released in June. The researchers then broke the results down by industry the way a quarterly earnings report breaks down a market. Below is a benchmark snapshot of where independent earnings stand today, which industries pay, and which ones run at a loss.
Key Highlights
- Across 31 industries, typical revenue for an earning 1099 business runs from about $850 to $77,000, with a midpoint near $19,200.
- Wholesale and distribution, healthcare, and construction post the highest typical earnings, while publishing, apparel, and e-commerce post the lowest.
- In 10 of the 31 industries measured, the typical business reports more in expenses than in revenue, meaning it operates at a median loss on paper.
- Earnings size and earnings quality move together. Higher-revenue industries tend to spend far less per dollar earned.
- Knowledge and service industries deliver both a higher floor and steadier income, while product and inventory industries behave more like a lottery: mostly small, with rare large winners.
The Headline Numbers
Independent business income is modest at the center and dramatically uneven at the edges. Among businesses that report both revenue and expenses, the typical industry median sits in the high five figures at the top of the table and the low hundreds at the bottom. Half of the 31 industries the researchers tracked post typical revenue above roughly $19,200, and half below.
1-800Accountant
The more revealing number is margin. Across most service industries, the median 1099 business reports between 45 and 80 cents of expenses for every dollar of revenue. But in roughly a third of all industries the researchers measured, that figure climbs above $1, meaning the typical operator spends more than it brings in. That pattern is not random. It tracks closely with what an industry sells.
Sector Performance: Who Earns the Most
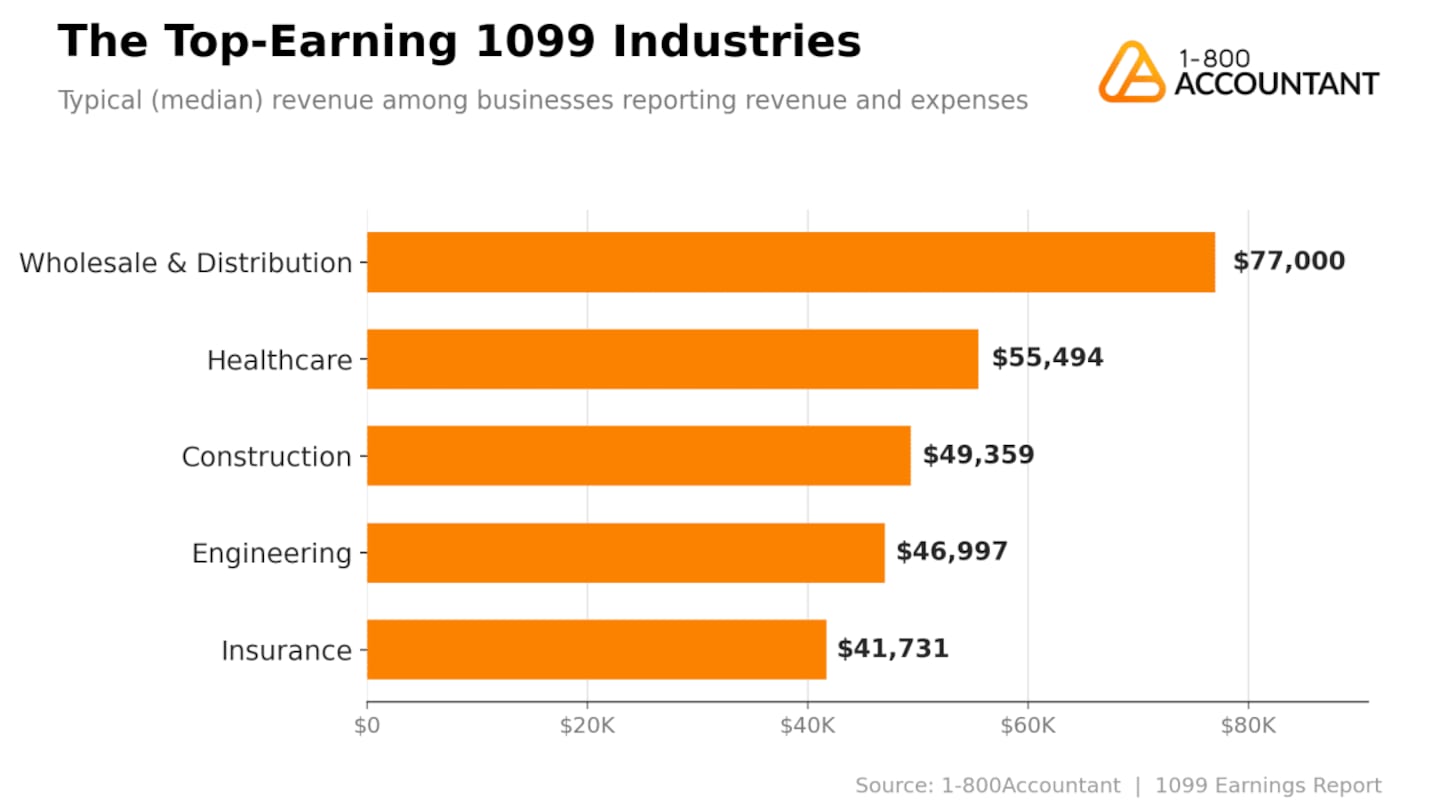
The top of the table is dominated by skilled services, distribution, and asset-light work.
1-800Accountant
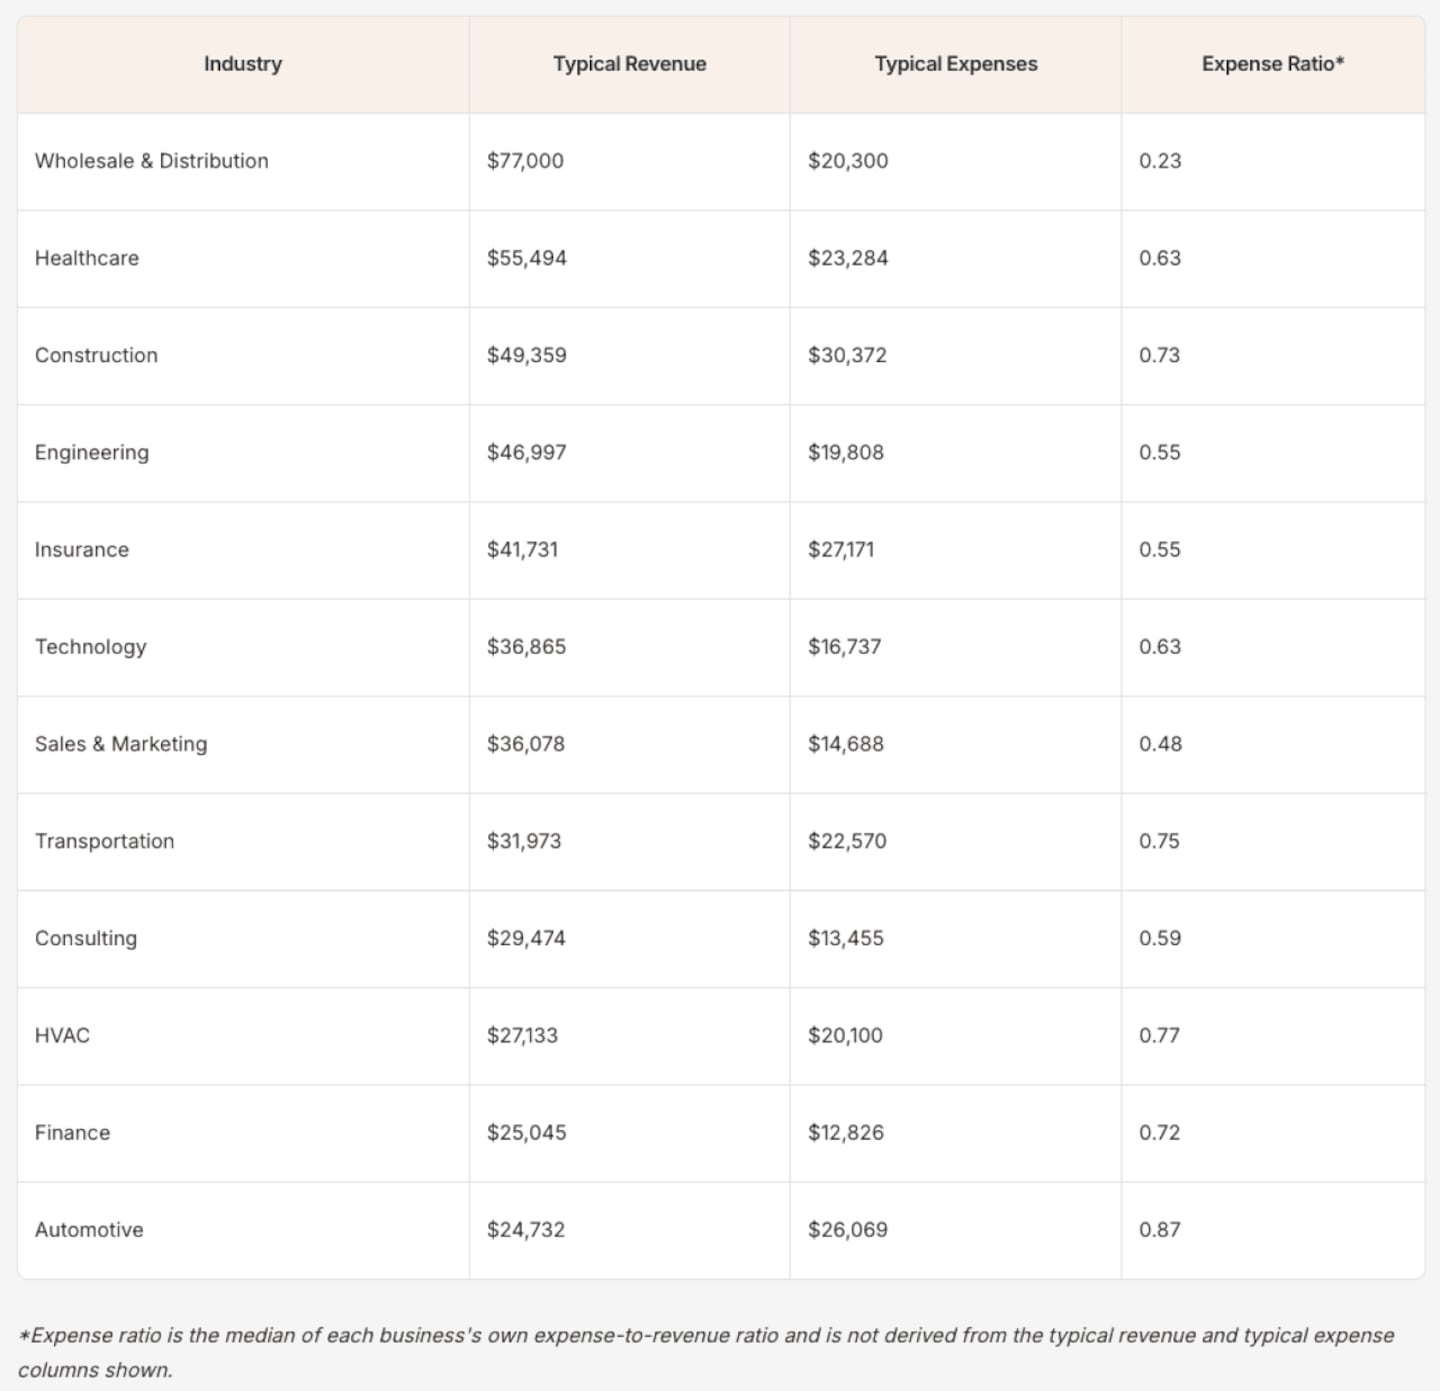
Wholesale and distribution leads at a typical $77,000 in revenue against $20,300 in expenses, by far the strongest margin of any industry measured. Healthcare and construction follow with high revenue but heavier cost structures, the kind of work that requires equipment, supplies, or facilities to deliver. Engineering and insurance round out the leaders with revenue above $40,000 and expense ratios near 0.55, meaning each keeps roughly 45 cents of every dollar earned.
What separates the leaders is not always the absence of overhead. It is whether the spending scales with the work. Distribution and skilled trades carry real costs, but those costs stay proportionate to what comes in.
Margin Watch: Who Keeps What They Earn
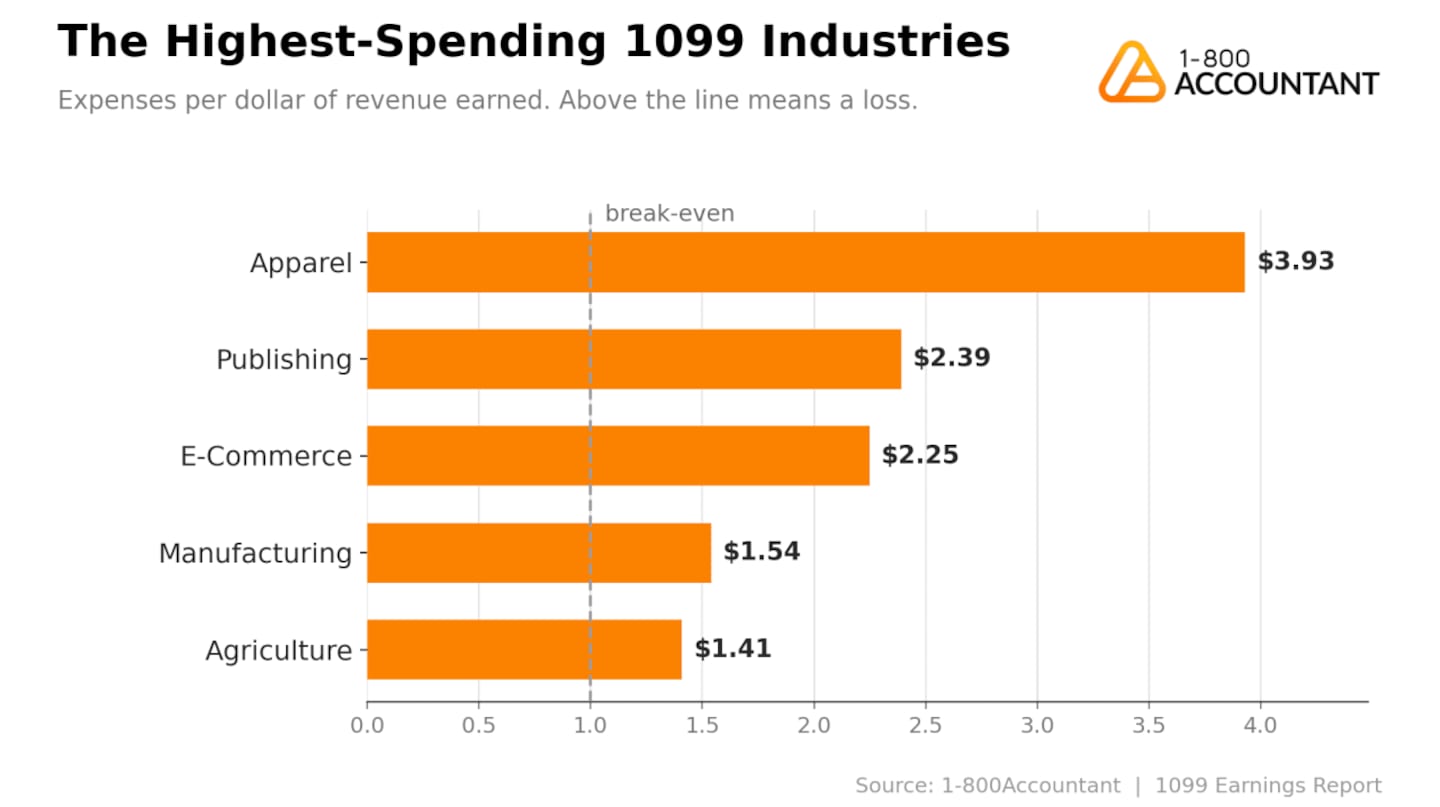
The bottom of the margin table tells a different story. Apparel, publishing, and e-commerce all report median expenses well above median revenue, with expense ratios between 2.25 and 3.93. The typical apparel business reports close to $4 in expenses for every $1 of revenue, and publishing's typical revenue of $847 is the lowest of any industry measured.
1-800Accountant
This is the central finding of the report. Across all 31 industries, typical revenue and the expense ratio carry a strong negative rank correlation of -0.82. Industries that earn the most also keep the most, and industries that earn the least tend to spend the most to do it. The dividing line is largely inventory and production. Businesses that buy, hold, or manufacture physical goods carry costs whether or not the goods sell, while businesses that sell time, expertise, or logistics do not.
One caution is worth stating plainly. In the lowest-revenue industries, a ratio above 1.0 often reflects early-stage or part-time ventures with real startup costs and minimal sales, not failing companies. A side business with $200 in supplies and $80 in sales posts a ratio of 2.5 while being perfectly healthy as a side project. Margin should be read alongside scale, not on its own.
The Spread: Steady Income or a Lottery
Typical figures hide how differently these industries behave at the top. The researchers compared each industry's typical earner to its top earners, defined as the 90th percentile.
The high-margin service industries are compressed. In Animal services, top earners make only about 4.2 times the typical operator. Hospitality, engineering, health and beauty, healthcare, and transportation all stay within a 5-to-7-times band. Income there is not only higher, it is more predictable.
The low-margin product industries are the opposite. In publishing, top earners clear roughly 144 times the typical operator. Agriculture, recreation, manufacturing, apparel, and e-commerce all show top-to-typical gaps of 37 times or more. These industries produce a handful of large winners sitting above a wide base of very small operators. For most participants the income is minimal, and for a few it is substantial.
For anyone deciding where to spend independent effort, the implication is that service, skilled trade, and distribution work offers a higher and more reliable floor. Product and inventory work offers a low floor with a long shot at a high ceiling.
What This Means for Independent Earners
The data points to a clear divide in the independent economy. Skilled-service and distribution businesses earn more, keep more of what they earn, and earn it more reliably. Product-based businesses face thinner margins and higher variance, which makes expense discipline and accurate bookkeeping the difference between a profitable year and a paper loss.
Methodology
Figures reflect 1-800Accountant's analysis of self-reported revenue and expense data submitted by over 30,000 clients for the tax year of 2025, covering 1099 businesses, freelancers, and independent contractors served by the firm across the United States. All revenue and expense figures are medians among businesses reporting both revenue and expenses, which is why they describe a typical active earner rather than every filer. The expense ratio is the median of each business's own expense-to-revenue ratio. Industries with fewer than 100 businesses were excluded, along with non-specific category buckets. This report is a single-period benchmark and does not measure growth over time. For background on how independent businesses report income, see the IRS guidance on Schedule C and self-employment tax, or the Small Business Administration.
This story was produced by 1-800Accountant and reviewed and distributed by Stacker.


